I have made two more custom components for Home Assistant available for use! These components calculate various meteorological metrics as well as the efficiency of evaporative air conditioning systems.
The first one calculates standard psychrometric states of moist air using ASHRAE 2009 Fundamentals formulations implemented in the psypy package. Atmospheric pressure and humidity must be given to calculate the other properties which are in turn used by the second custom component cooler_efficiency.
Advertisement Begins
Advertisement End

This second sensor component calculates the percent efficiency of your evaporative air conditioning system given sensory inputs such as temperature, humidity and wet bulb temperature (a value supplied by the meteorologic_metrics component)

Note that this component requires the wet bulb temperature (WBT, a metric measured by a temperature sensor wrapped in a wet cloth). The purpose of this is to measure the cooling effect of evaporation. Since this is impractical to measure without special equipment, I have created another component called meteorologic_metrics which calculates the WBT given the temperature, humidity and pressure at your location.
The simplest way to process is to install both components and use one as the input to the other. If there are other ways for you to determine the wet bulb temperature, then you can use that sensor entity instead. Some weather components for your weather forecasting component may provide this (though it will not be the most accurate unless you live right next to a weather station.)
Affiliate Content Start

Apple AirPods (3rd Generation) Wireless Ear Buds, Bluetooth Headphones, Personalized Spatial Audio, Sweat and Water Resistant, Lightning Charging Case Included, Up to 30 Hours of Battery Life
$138.59 (as of May 20, 2024 11:11 GMT +08:00 - More infoProduct prices and availability are accurate as of the date/time indicated and are subject to change. Any price and availability information displayed on [relevant Amazon Site(s), as applicable] at the time of purchase will apply to the purchase of this product.)
occiam Wireless Earbuds Bluetooth Headphones 96hrs Playback Sport Ear Buds Earphones Over Ear Deep Bass with Earhooks Microphone for Working Out Running Gym TV Listening (Black)
$25.99 (as of May 20, 2024 11:11 GMT +08:00 - More infoProduct prices and availability are accurate as of the date/time indicated and are subject to change. Any price and availability information displayed on [relevant Amazon Site(s), as applicable] at the time of purchase will apply to the purchase of this product.)
[Apple MFi Certified] Wireless Earbuds for AirPods Pro Wireless Headset with Touch Control, Noise Cancelling, Built-in Microphone with Charging case IPX7 Waterproof
$15.99 (as of May 20, 2024 11:11 GMT +08:00 - More infoProduct prices and availability are accurate as of the date/time indicated and are subject to change. Any price and availability information displayed on [relevant Amazon Site(s), as applicable] at the time of purchase will apply to the purchase of this product.)Affiliate Content End
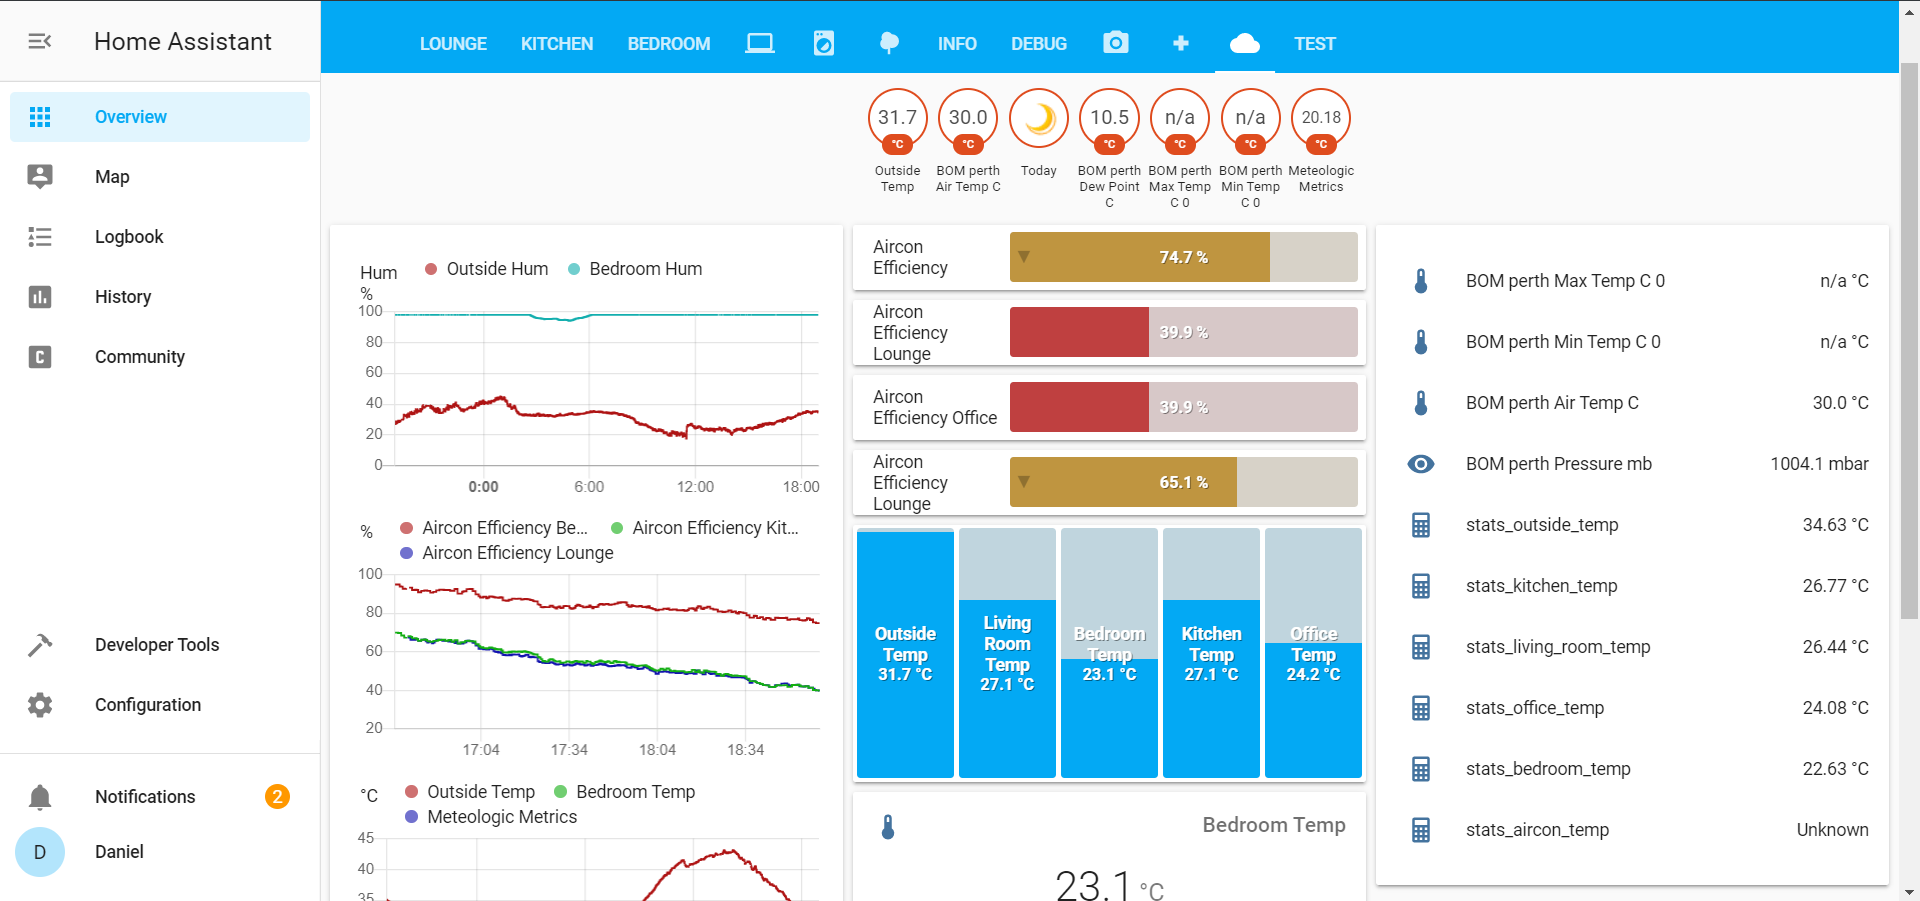
Home Assistant Dashboard
I created a few different instances of these components (one for each temperature sensor/room I have in the house.) The dashboard below shows graphs of the calculated wet bulb temperature (the lowest temperature that can be achieved using evaporative cooling) as well as the actual indoor temperatures (how close the evaporative cooling system was able to get).

It appears on particularly hot days (we had a heatwave of four consecutive days above 40 degrees maximum temperature), the cooler is very efficient. My bedroom is the best room in the house, maybe because it is facing north with only a 1m stretch of external facing wall. Very little attack surface for heat to get in. The room is also right underneath the AC unit, possibly getting the highest airflow (based purely on speculation). Another reason could be a particularly well-placed sensor as the AC airflow is hitting it directly.
I have ordered a Bluetooth low energy (BLE) temperature humidity sensor which will be kept in the AC duct to measure the air temperature at the source (rather than when it is mixed with room air). This will provide a more accurate reading for AC efficiency.


