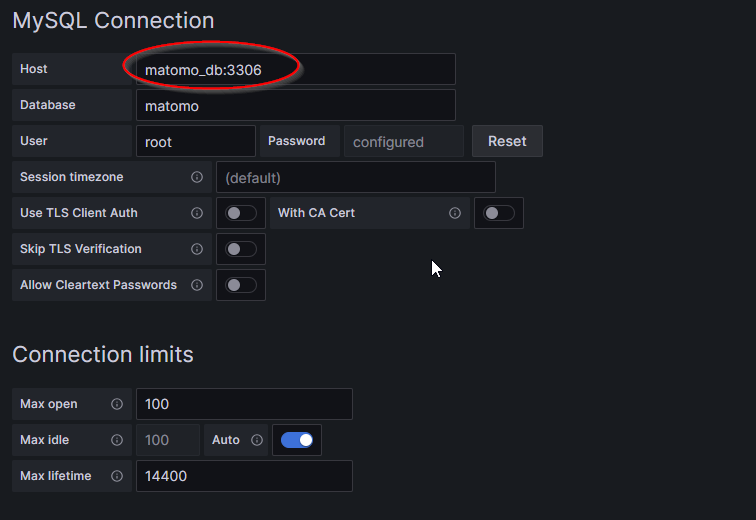
I faced a curious problem where my Grafana instance suddenly would be unable to connect to the database after working fine for days. The logs indicate the Grafana container attempting to connect on port 53, when MariaDB runs on 3306. Of course, this shows it may be DNS-related.
Act 1: Grafana Logs Error Message
The logs are included below:
grafana-grafana-1  | 2023-09-23T11:50:06.402836740Z [xorm] [info]  2023/09/23 11:50:06.402682 PING DATABASE mysql
grafana-grafana-1  | 2023-09-23T11:50:06.404357301Z logger=tsdb.mysql t=2023-09-23T11:50:06.404252888Z level=error msg="Query error" err="dial tcp: lookup matomo_db_1 on 127.0.0.11:53: server misbehaving"
Affiliate Content Start
Outlet Extender Surge Protector - NUOZHI 6 Outlet Splitter with 4 USB Ports(2 USB-C), Multi Plug Wall Outlet 1680J Power Strip for Home Office Dorm Room Essentials, ETL, White
$9.98 (as of February 20, 2026 18:05 GMT +08:00 - More infoProduct prices and availability are accurate as of the date/time indicated and are subject to change. Any price and availability information displayed on [relevant Amazon Site(s), as applicable] at the time of purchase will apply to the purchase of this product.)Amazon Fire TV 32" 2-Series (newest model), HD smart TV with Alexa Remote, fast streaming, Dolby Audio, Ambient Experience, free and live TV
$143.99 (as of February 20, 2026 18:05 GMT +08:00 - More infoProduct prices and availability are accurate as of the date/time indicated and are subject to change. Any price and availability information displayed on [relevant Amazon Site(s), as applicable] at the time of purchase will apply to the purchase of this product.)TERUNSOUl 4K+1080P+1080P Dash Cam Front and Rear, 3 Channel Dashcam, Free 128GB Memory Card, Built-in 5.8GHz WiFi Built-in GPS, Collision Sensor, Night Vision, 3.16" IPS, 24H Parking Mode(Black)
$99.99 (as of February 20, 2026 18:05 GMT +08:00 - More infoProduct prices and availability are accurate as of the date/time indicated and are subject to change. Any price and availability information displayed on [relevant Amazon Site(s), as applicable] at the time of purchase will apply to the purchase of this product.)Affiliate Content End
The Google search
After googling “docker ip lookup failing” and “docker 127.0.0.11:53: server misbehaving” I came across the linked article below for an unrelated issue, however, the commenter suggested using docker network inspect and docker container inspect .
Act 2: Docker Network Inspect Command
The plot thickens…. by taking a closer look at the docker network and containers, I was able to validate that both containers (MariaDB and Grafana) are indeed still on the same docker network.
MY MISSION
This blog started nearly 10 years ago to help me document my technical adventures in home automation and various side projects. Since then, my audience has grown significantly thanks to readers like you.
While blog content can be incredibly valuable to visitors, it’s difficult for bloggers to capture any of that value – and we still have to work for a living too. There are many ways to support my efforts should you choose to do so:
Consider joining my newsletter or shouting a coffee to help with research, drafting, crafting and publishing of new content or the costs of web hosting.
It would mean the world if gave my Android App a go or left a 5-star review on Google Play. You may also participate in feature voting to shape the apps future.
Alternatively, leave the gift of feedback, visit my Etsy Store or share a post you liked with someone who may be interested. All helps spread the word.
BTC network: 32jWFfkMQQ6o4dJMpiWVdZzSwjRsSUMCk6
[
    {
        "Name": "local",
        "Id": "9688511103c6d49d0184f023da3c294d8a5c871305997d5a42cc862a7647a1bc",
        "Created": "2021-09-10T15:24:49.835878943Z",
        "Scope": "local",
        "Driver": "bridge",
        "EnableIPv6": false,
        "IPAM": {
            "Driver": "default",
            "Options": {},
            "Config": [
                {
                    "Subnet": "172.18.0.0/16",
                    "Gateway": "172.18.0.1"
                }
            ]
        },
        "Internal": false,
        "Attachable": false,
        "Ingress": false,
        "ConfigFrom": {
            "Network": ""
        },
        "ConfigOnly": false,
        "Containers": {
            "31de96114eec6c5486ece14f7fa29696ab56036000b7e7fe44012a518adedc8f": {
                "Name": "grafana-grafana-1",
                "EndpointID": "6c15ba93aa83c9dfc581a64aabeb6120b26c1f0dcaad643929341bc6b675c040",
                "MacAddress": "02:42:ac:12:00:02",
                "IPv4Address": "172.18.0.2/16",
                "IPv6Address": ""
            },
            "e07e243a014850a5d5d1ebbb157f39552d39d6ac66990a2af113912cc32cebf1": {
                "Name": "matomo-db",
                "EndpointID": "4f4bffd9054cec3fce575b05c333e4d36f3bb9fb920552db59908519b748b2e4",
                "MacAddress": "02:42:ac:12:00:06",
                "IPv4Address": "172.18.0.6/16",
                "IPv6Address": ""
            }
]
...
I looked at the exact hostname and the dash caught my eye because for years my Docker containers used underscores in their names. I double-checked my data source settings in Grafana and sure enough, the hostname uses an underscore. I thought this couldn’t be right why would the host change!??

As it turns out, the Maria DB container is now using dashes matomo-db rather than underscores matomo_db.
Then I realised that the Docker Compose upgrade I performed yesterday from 1.29.2 to 2.22.0 must have resulted in the difference in container names. Seems like an odd decision to cause a breaking change for the sake of using dashes in container names.
Kitchen Multi-Timer Pro
Now you’re cooking
Multi Timer Pro is your ultimate meal prep companion, keeping track of multiple cooking times and making adjustments on the fly. Give it a try today and become a better home cook!


